
Changing weather conditions, COVID-19 mandates, road closures: making an accurate map when the territory shifts under your feet is problematic. If you need that map to guide you to safety or away from danger, it’s even more crucial to map for uncertainty.
Dr. Lace Padilla is an expert in those gray areas. An assistant professor in the cognitive and information sciences department at the University of California, Merced she’s worked with organizations including the Red Cross and the National Science Foundation on projects about wildfire risks, energy grids and tsunami warnings.
“The way uncertainty is presented has a profound influence on our judgments,” she said in a recent Data Visualization online meetup. As a cognitive scientist, she specializes in models that help break apart the different reasoning processes that go on in our minds.
The problem: most of us can’t get our heads around probabilities, Padilla says. (From the questions and chat dialogue during the event, there may have been only a few of us – ok, me! – wishing we hadn’t settled for the lowest possible passing grade in college statistics. Confidence intervals, indeed.)
“People are bad at reasoning with probabilities” (@lacepadilla)…Hurricane warnings w/the Cone of uncertainty (L) vs Damage Radiance (R) #resiliency #maps #disasterprep pic.twitter.com/IdmNCwdZH3
— Resiliency Maps (@resiliencymaps) February 24, 2022
What’s clear, though, is that there are better methods for visualizing and understanding what we don’t know.
Take, for example the infamous “cone of uncertainty” hurricane warning maps. For the people who calculate such things, it represents a percent confidence interval (these can vary widely – 50 percent, 66 percent), or an “envelope around the mean path.” The trouble starts when a person watching the Weather Channel looks at one of these map and thinks, ah, OK, not in my neighborhood. When people see cones, they think it’s the size of the storm.
The key, Padilla says, isn’t that the general public gets more adept at estimating probabilities. (Whew. I for one, will never become best buds with Bernoulli.) She and her fellow researchers ask people about behavioral judgement, in other words, how they would act given the information presented.
“What we see from this study and all of our subsequent studies is that people see a danger zone and a safe zone. They’re very worried if the cone covers anywhere that they care about, but if the cone just misses it they feel like they’re going to be fine.”
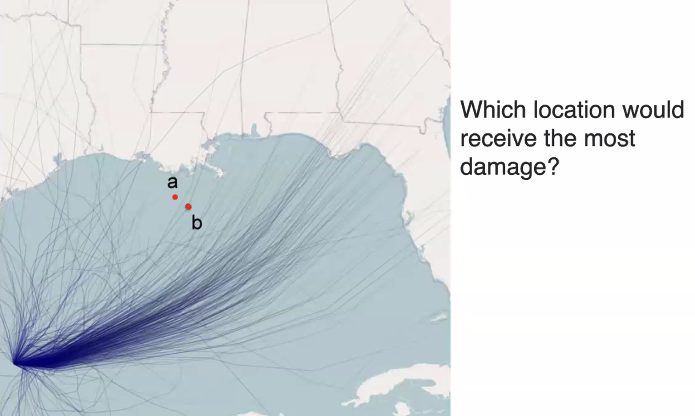
The hurricane diagram on the right shows “damage radiance” over a period of time, nudging people towards better judgement about staying put or evacuating. Though the lines don’t fix everything: Padilla says that people tend to misinterpret the danger, thinking if the line falls right on a point, it’s less dangerous than if the point falls inside.
If it’s common knowledge that maps lie, getting them right in disasters means creating a whole new visual vocabulary, making maps that can be interpreted correctly – almost at emoji level.
“We can give people instructions, we can tell them it doesn’t show the size…but it’s very hard to get people away from that interpretation because the cone is literally getting larger as it travels over space,” Padilla says.
Why do our brains do this?
“We think it has something to do with the schema. We’re showing people a map, they’re using the schema they’ve learned for maps, which suggests that in a physical area, any type of pixel width that you have can be translated into physical distance in the world.”
As disasters become more frequent, we’ve got to learn — and unlearn — a lot about maps.
“When we’re little and we’re taught to use maps, we’re often taught to take our little ruler out and measure distances and do a calculation to approximate the distance in the physical world. To interpret these correctly people would have to suppress a lifetime of map use.”
Padilla is that rare academic who can dial down the jargon without over simplifying; you’ll feel smarter after these 90-minutes with her. She offers up some great case studies, like calculating when farmers in Peru should protect their alpacas from increasing cold snaps and a low-cost, effective hurricane warning system in Haiti.
While she and her colleagues may use tools that are on the sophisticated side for the general user (R features heavily) some of her advice is useful for all community map makers, like opting for grayscale in charts and maps whenever possible to avoid multiplying the tricks our eyes play on us.
Catch her whole presentation on YouTube and check out the paper Dr. Padilla and colleagues wrote providing a comprehensive review of data visualization studies.
Photo courtesy of Gratisography