As part of the project we’re trying out different ways to visualize OpenStreetMap features to create custom maps. So far we’ve tried uMap and Mapbox.
This tutorial uses QGis 3, a free and open-source cross-platform desktop geographic information system application. You can download it here.
Getting started
Once you’ve installed QGis, you’ll need a pair of plugins:
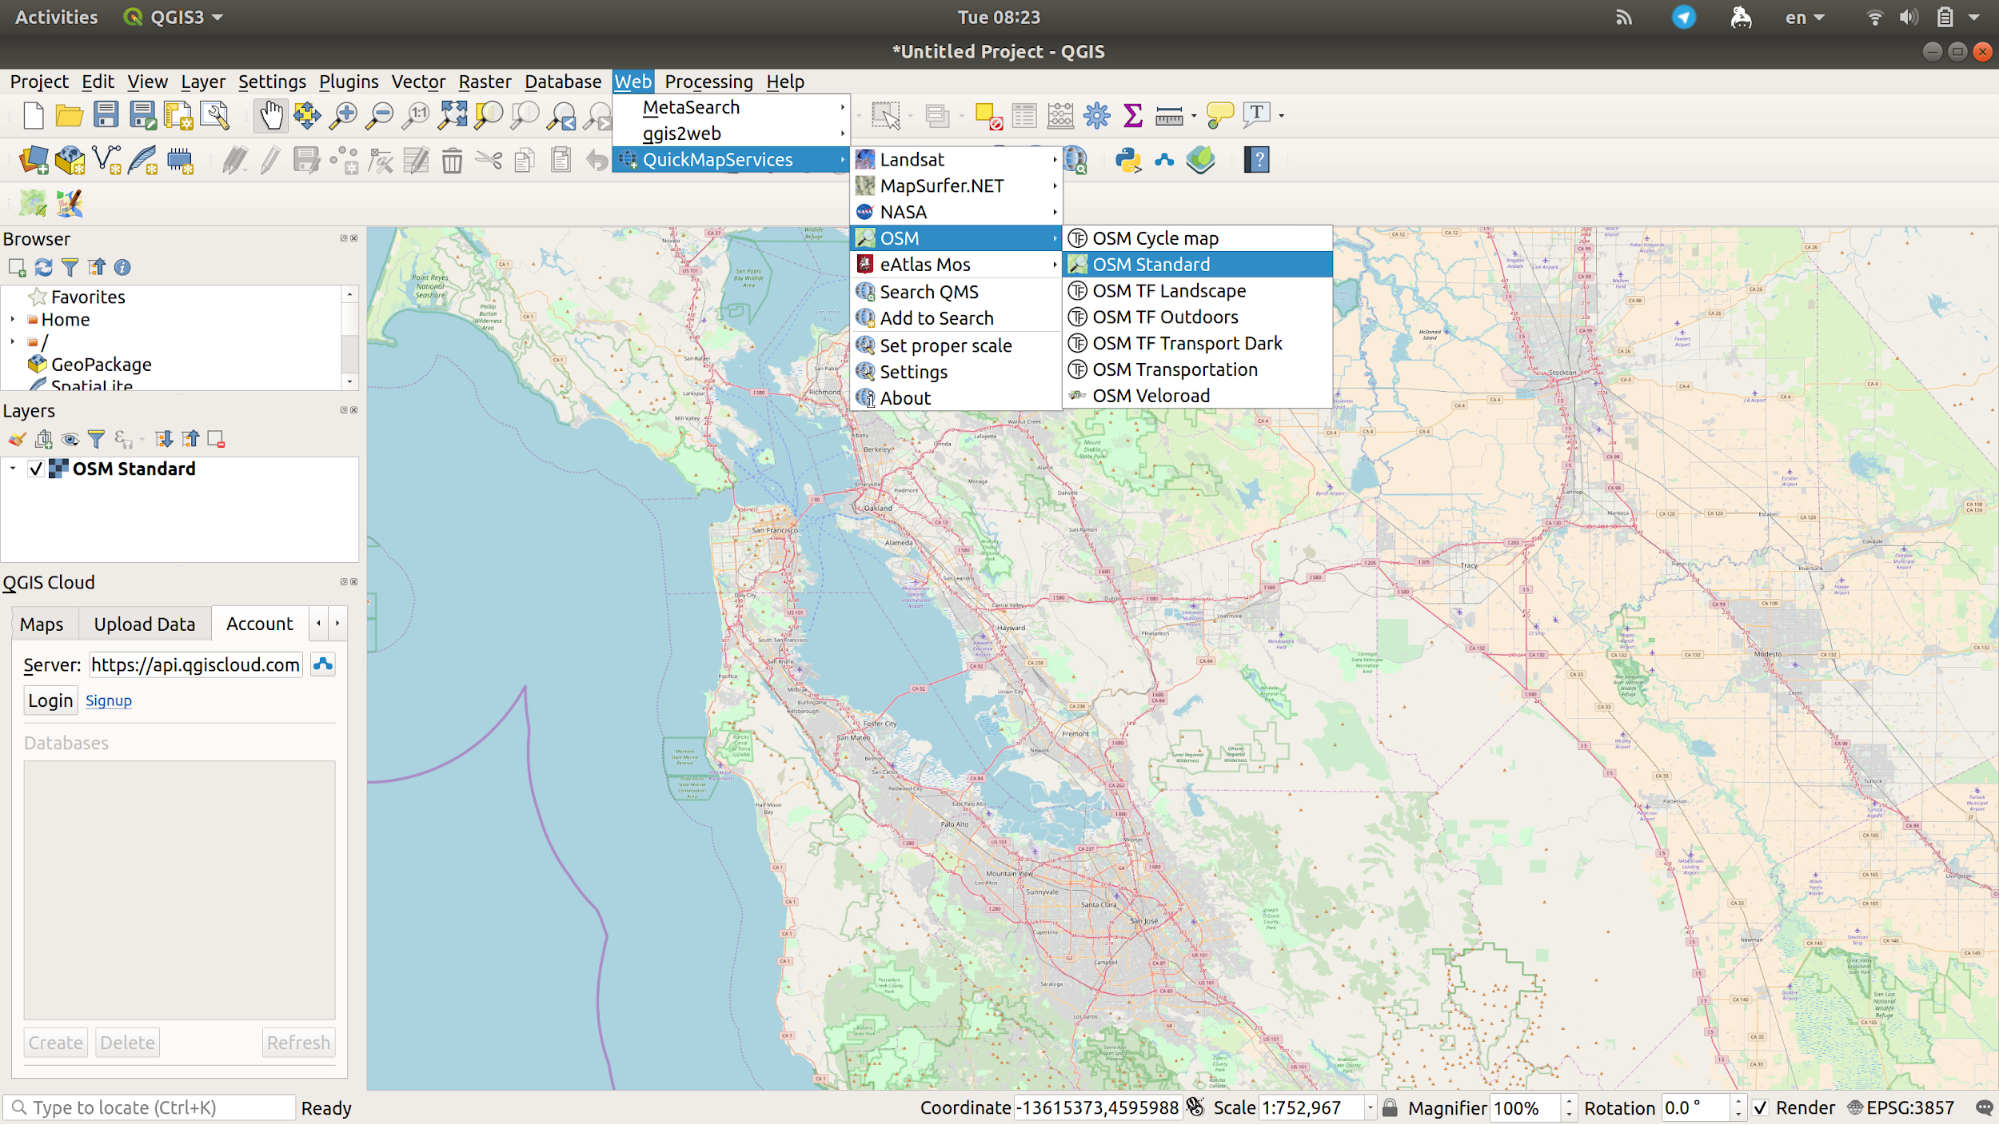
QuickMapServices
Built by NextGIS, this is our basemap. It also provides a convenient list of services search for finding datasets and basemaps. Download the latest version.
QuickOSM
QuickOSM allows you to download OSM data thanks to the Overpass API. You can also open local OSM or PBF files. A special parser, on top of OGR, lets you see all of the available OSM keys.
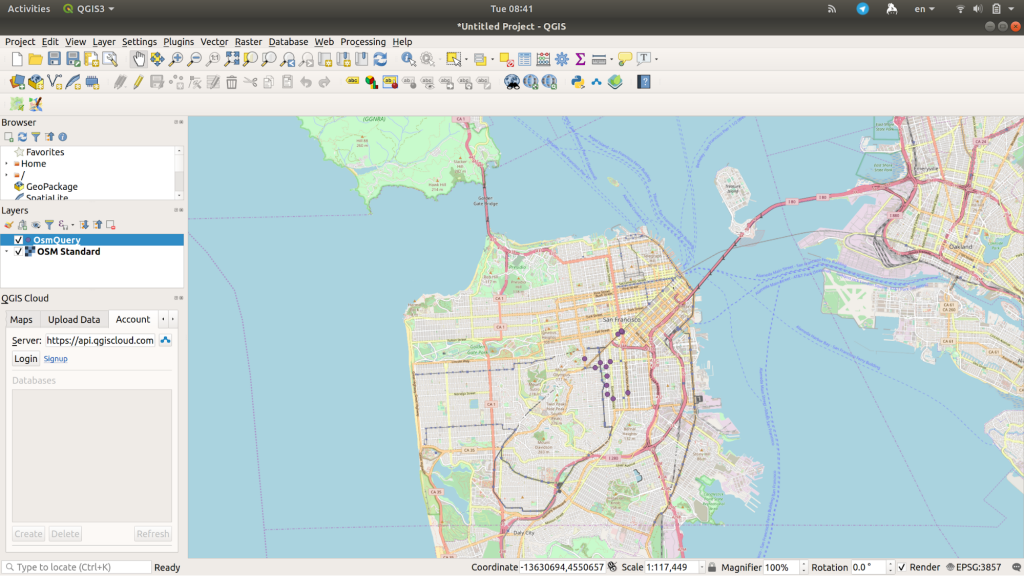
Once you’ve created the basemap, zoom in the on the area of interest. Then download the features you want to show on your map.
For example, we want to visualize a layer of fire alarm boxes. In order to see the most recently mapped ones, go to the QuickOSM plugin. Zoom into San Francisco, then chose Vector > QuickOSM > QuickOSM to get the layers you need.
In the QuickOSM window, Quick Query add “emergency” as key and “fire_alarm_box” as value. Click on Advanced and add a file name to save the results of the query (QuickOSM doesn’t save the results of queries by default).
The full query for Overpass looks like this:
<osm-script output="xml" timeout="25">
<union>
<query type="node">
<has-kv k="emergency" v="fire_alarm_box"/>
<bbox-query {{bbox}}/>
</query>
<query type="way">
<has-kv k="emergency" v="fire_alarm_box"/>
<bbox-query {{bbox}}/>
</query>
<query type="relation">
<has-kv k="emergency" v="fire_alarm_box"/>
<bbox-query {{bbox}}/>
</query>
</union>
<union>
<item/>
<recurse type="down"/>
</union>
<print mode="body"/>
</osm-script>
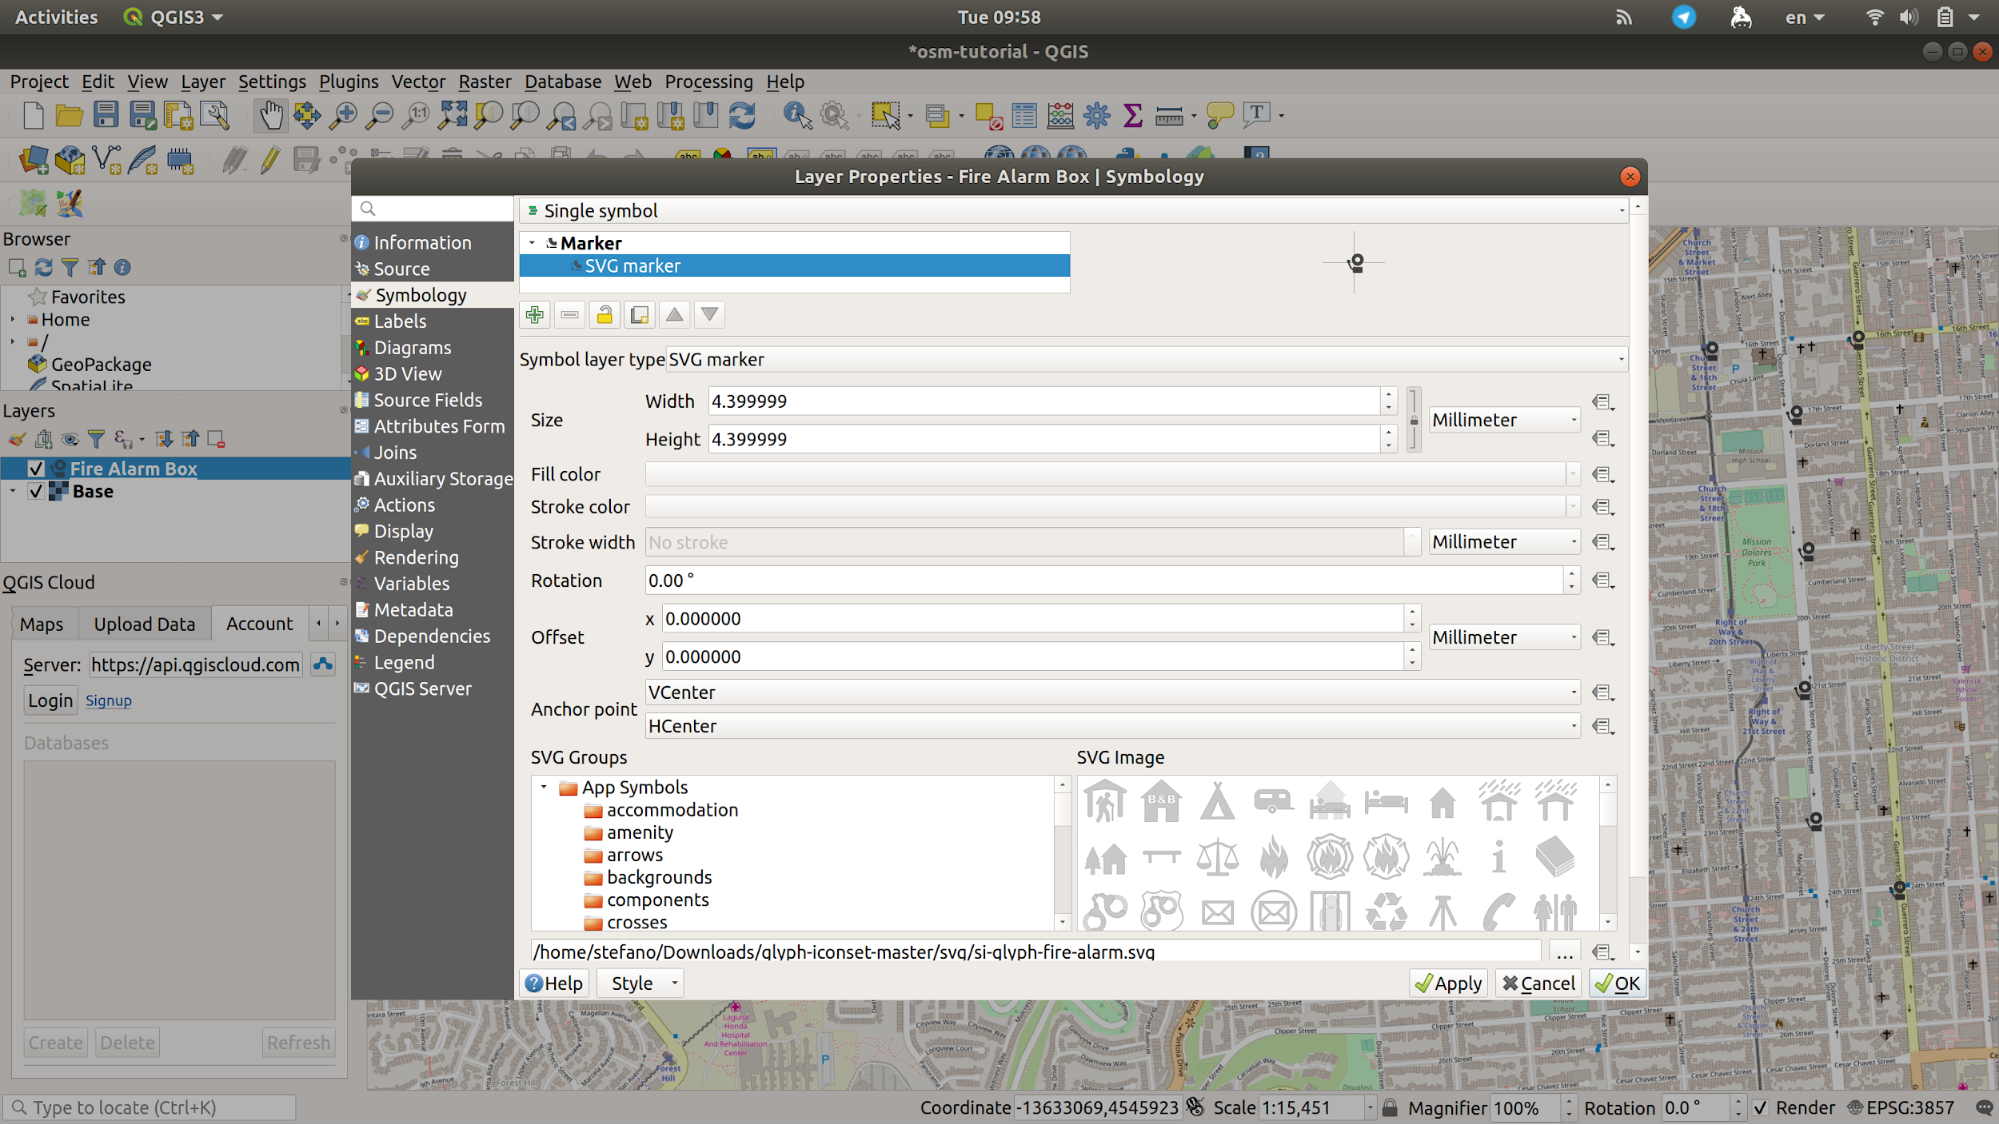
Change the layer name to Fire Alarm Box and the marker to something more appropriate than the default circle. Here we’re using the fire alarm icon from http://glyph.smarticons.co/ Change the marker type to SVG, find the file you want to use and change its size so it can be seen on the map.
 Then just rinse and repeat, adding the features you need.
One thought on “How to create a resiliency map with QGis”