
You can spend most of your life in a city and still feel lost sometimes. That’s what I found out after moving from a quiet, fog-bound San Francisco neighborhood into one dominated by construction cranes and the not-so-distant noises of car-repair shops. Though only a couple of miles and a few craggy hills away, it’s a world apart in terms of potential hazards in the event of an earthquake or major disaster.

My move downtown coincided with retraining with the fire department for Neighborhood Emergency Response Training or NERT. The program, launched after the 1989 Loma Prieta quake, teaches residents to prepare for the next one with an eye to not becoming a victim. It mirrors the Federal Emergency Management Agency’s community emergency response team (CERT) curriculum, covering fire safety, light search and rescue, team organization and disaster medical operations. Perhaps most importantly, these preparedness programs teach you to look at your surroundings differently, from identifying unreinforced masonry buildings to spotting which hydrants carry drinking water.
Where to next?
The training advises participants to make room for a paper map in their emergency kits and go bags. A paper map sounds like such a step backwards — for awhile the one in my backpack was a not-to-scale version handed out by the tourist board — but the digital maps we rely on may not be available offline and power outages will make conserving the smartphone batteries for emergency use a priority.

My own sense of disorientation in crowded cities pushed me to think about making a map that charts assets and hazards in the neighborhood with a view to staying safe in an emergency. This resiliency map would make more visible soft-story buildings, police and fire call boxes, fire hydrants, schools and community centers that might serve as shelters as well as chemical hazard warnings posted outside gas stations, auto repair shops and construction sites. I’ve now launched Resiliency Maps (RM) as a platform and service model that combines technology with community map-building efforts.
Preparedness maps are the cornerstone of any emergency management plan, but what makes Resiliency Maps unique is that each community draws their own and takes ownership of the results. To make Resiliency Maps work, they will eventually stretch to cover the whole city. We’re open to collaboration from anyone and the more people participating the more effective they are. Open and accessible maps serve as vital preparation and awareness tool in a city where it’s estimated to take six to 10 hours before outside help arrives.
Resiliency Maps builds on earlier efforts, such as OpenStreetMap (OSM), a collaborative project to create a free editable map of the world founded in 2004. Dubbed the Wikipedia of maps, the data produced by volunteers is now used by companies including Facebook, Bing, Craigslist, Apple, MapQuest and Foursquare. As Tim Berners-Lee, creator of the web, put it: “OpenStreetMap is all about people doing their bit, creating an incredible resource for everybody else.”

Like many of the most useful internet tools, Resiliency Maps is built on open-source technology and offered as a community service. In addition to the huge benefits to adopting an open source, open collaboration model, there are a number of other reasons that building these maps with OSM makes sense. To create both the Resiliency Maps process and platform, the underlying technology needs to be flexible and modular. Which is a complicated way of saying you need methods to train anyone who might want to contribute — pen and paper, street-level imagery, smartphone — with the capability to customize, visualize, download and print them.
All of these capabilities are available with OSM. Another benefit is that most of the RM features outlined above are already available. For those missing, there’s a standardized process for adding them to the database with a unique tag to make them discoverable and therefore visible on a map printout. (To date, we’ve added tag a for fire call boxes and made the “soft-storey” building tag already in use official.) OSM has a built-in review and edit process for data-entry and validation and an active global community watching over bad edits and the occasional vandalism.
Mapping it out with the community

Resiliency Maps is just getting started, but we have already plotted a few milestones for data collection. We hold community map-building exercises that collect local data and are also informative and fun. These events bring the community together, which is a critical step in improving outcomes during a disaster. Our first mapathon was a two-hour session using Field Papers, an open-source project that gets a large group mapping without requiring people to bring laptops or have any OSM knowledge. You choose an area to map, print it out, walk outside with the paper copy, mark things up, then scan or take a photo with a QR code, and it’s added as a layer to OSM. At our event, teams of three or four emergency response volunteers made a mad dash around San Francisco’s South of Market neighborhood on a Saturday morning, updating construction sites, adding hydrants and fire call boxes, jotting down hazard diamonds and the like.
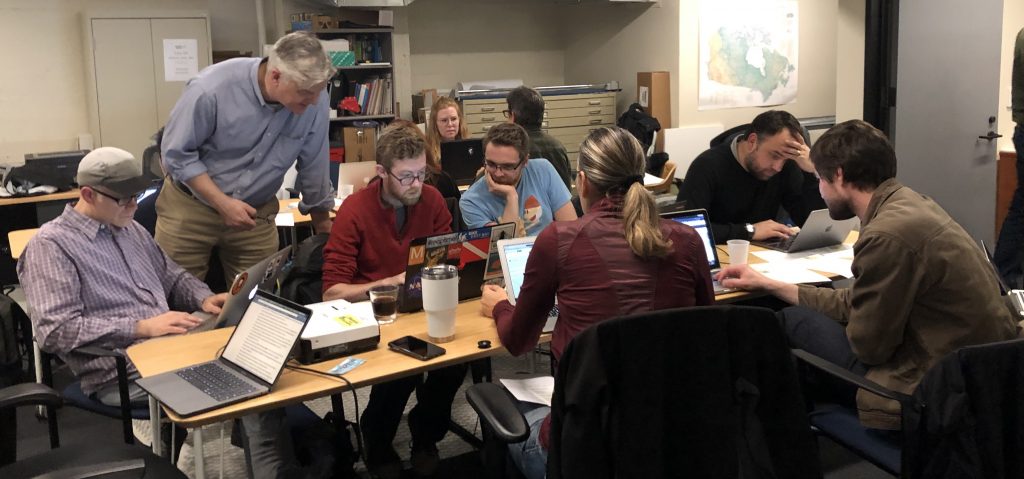
Another mapathon was completely digital: MaptimeSF, a global meetup group focused on “making maps, talking about maps, and geeking out on all things techy and spatial,” hosted Resiliency Maps. This time we used Mapillary, a startup that provides ground-level imagery integrated into OSM. Participants used the images to verify and add points on the map, making about 230 changes in under two hours. At 4 a.m. the next day, a 3.4 magnitude quake centered in Oakland shook the Bay Area awake, providing a reminder about why making these maps matters!
As we expand, we’re adding new areas of focus that are relevant to today’s challenges. For example, we’re currently working on processes for outreach to cooling centers when the heatwaves hit and preparation for power outages during wildfire season.
While San Francisco may be one of the places that Hollywood loves to destroy the most — whether it’s from quakes, flames, tsunamis or alien invasion — the city by the bay faces a number of other emergency scenarios and Resiliency Maps will help people prepare.